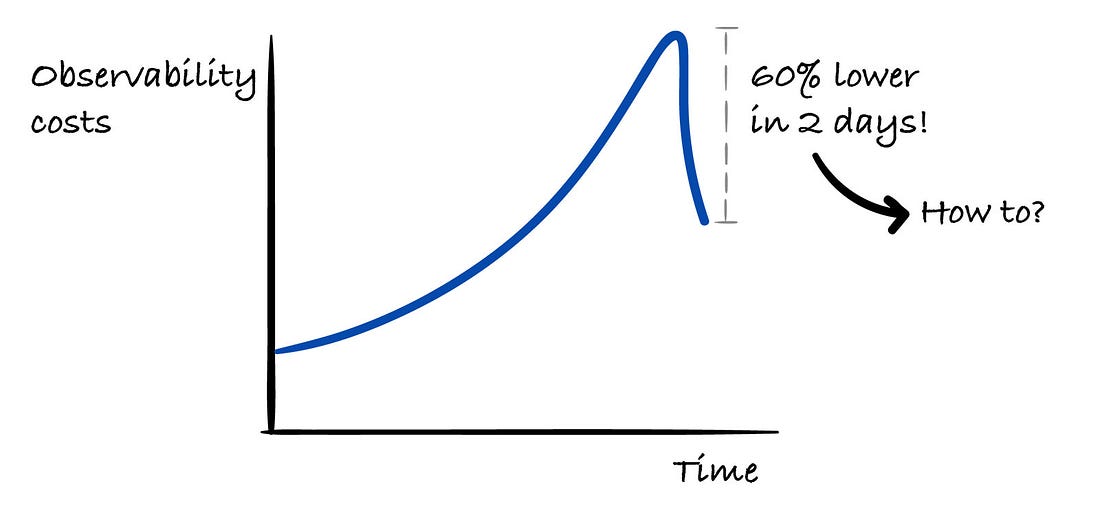
How I Cut Observability Costs by 60% in 2 Days
- Gregor Ojstersek from Engineering Leadership <gregorojstersek@substack.com>
- Hidden Recipient <hidden@emailshot.io>

Hey, Gregor here 👋 This is a free edition of the Engineering Leadership newsletter. Every week, I share 2 articles → One paid edition and one free edition, with a goal to make you a great engineering leader! Here are some of the recent popular paid articles you might have missed: How I Cut Observability Costs by 60% in 2 DaysIf you don’t watch your infrastructure costs, you may end up with a huge bill at the end of the month. This is how an experienced engineer approached reducing observability costs.
This week’s newsletter is sponsored by Unblocked. [Webinar] Can you prove AI is working? AI is in your engineering workflow. While the token spend shows it, the throughput doesn’t. The human is very much still in the loop, and that’s a context problem.
Join live on Aug 19 (FREE) to learn:
Thanks to Unblocked for sponsoring this newsletter. Let’s get back to this week’s thought! IntroWhat I’ve seen happen many times in my career:
But then, once the free credits are gone, they get surprised with a huge bill. Then, they try to ruthlessly optimize the costs, but often it’s too late. The architectural choices have been made, and switching becomes a lot harder. It’s really important to keep in mind and have control of the cost of your tools and always try to optimize your spend-to-value ratio. It’s especially important for all the startups that are just starting. The main focus should be on getting to product-market fit, not skyrocketing your bill for cloud costs. In today’s article, we’ll go through a real-world case study of how John Gallagher, a seasoned engineering professional, optimized observability costs without losing value. Let’s introduce our guest author and get started! Introducing John GallagherJohn Gallagher is a principal engineer, consultant, and coach/mentor, focusing on helping engineering teams to improve production stability.
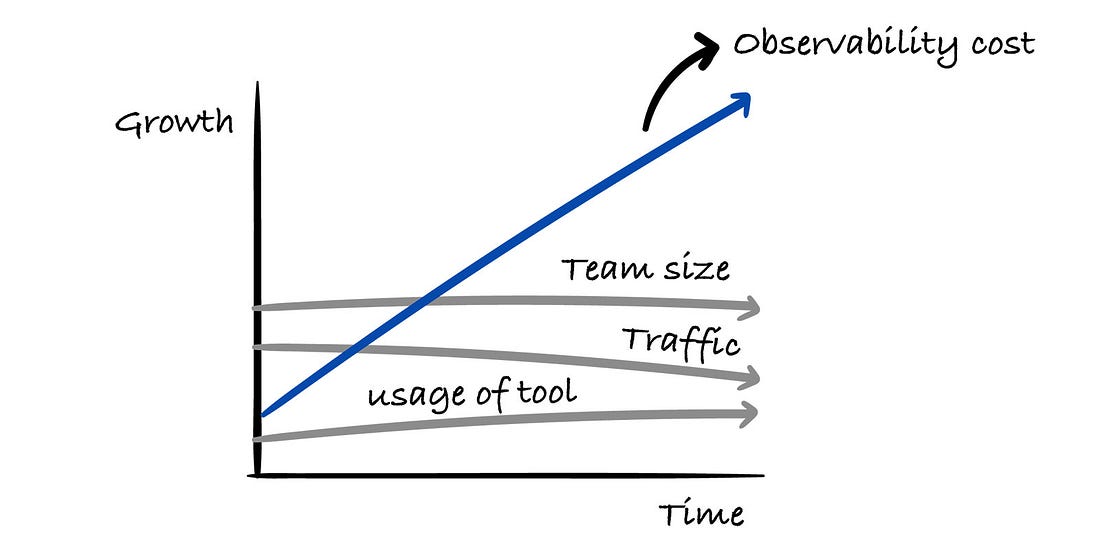
Today, John will share how to spot the potential red flags, reduce signal noise, and lower monthly cloud bill on observability tools. Over to you, John! The accidental discoveryI’ve always been interested in how much companies cost to run. I’d worked on introducing observability into our company and knew that observability tooling can be costly. So one afternoon, out of curiosity, I pulled up our observability bill to see how things were trending. At first glance, everything seemed normal. Month over month, the increase was modest: maybe 8–10% each month. But then I looked at a six-month view. Our costs had gone from around $1,000 per month to around $2,500 per month.
I thought about what had changed in that time:
Something didn’t add up. We weren’t getting 2.5x the value from our observability tool, yet we were paying 2.5x more for it.
The granularity cliffThe $2,500 on our bill was broken down into traces, metrics, and logs. Beyond that, detail was hard to find. Most observability tools give high-level billing reports. In the tool we used, I could get costs by service. That wasn’t enough. I needed to answer deeper questions:
The billing report didn’t allow this level of detail. I’d reached the edge of what I call the granularity cliff. Many engineering leaders stop here. They don’t have time to dig into the details. Even when they do, they often lack the knowledge of the observability tool’s query language or the ability to group, filter, and analyze logs at scale. Earlier in my career, I fell off this cliff constantly. I’d see that $2,500 number, feel vaguely uncomfortable, and not know what to do next. So I’d ignore it and work on other tasks. There was always something more urgent: a feature to ship, a bug to fix, a meeting to attend. But this time I wanted to take a different approach. I resolved to tackle the cost issue head on. I went through 6 steps. Step 1: Understand the cost modelBefore I could lower our costs, I needed to understand how our observability vendor charged us. Different vendors have different pricing models:
You pay based on the number of log events ingested. Each signal costs you money, regardless of how much data is in it.
You pay based on the total size of data ingested. A 10KB log costs you more than a 1KB log.
You pay based on some combination of events and volume, or you pay tiered pricing based on retention. We were on per-event pricing with our tool. This meant that the number of log lines mattered much more than the size of each log. A 1KB log and a 10KB log cost us exactly the same. This directed my optimization strategy. If we’d been on per-data-volume pricing, I would have focused on reducing log size. But since we were per-event, I needed to reduce the number of logs.
Step 2: Choose the signal to optimizeModern observability tools can include multiple signals:
Each signal has its own cost structure and optimization strategies. I chose to focus on logs for 3 reasons:
We wrote the code that generated the logs. I could change them directly.
I understood logging deeply. I’d written most of our logging myself.
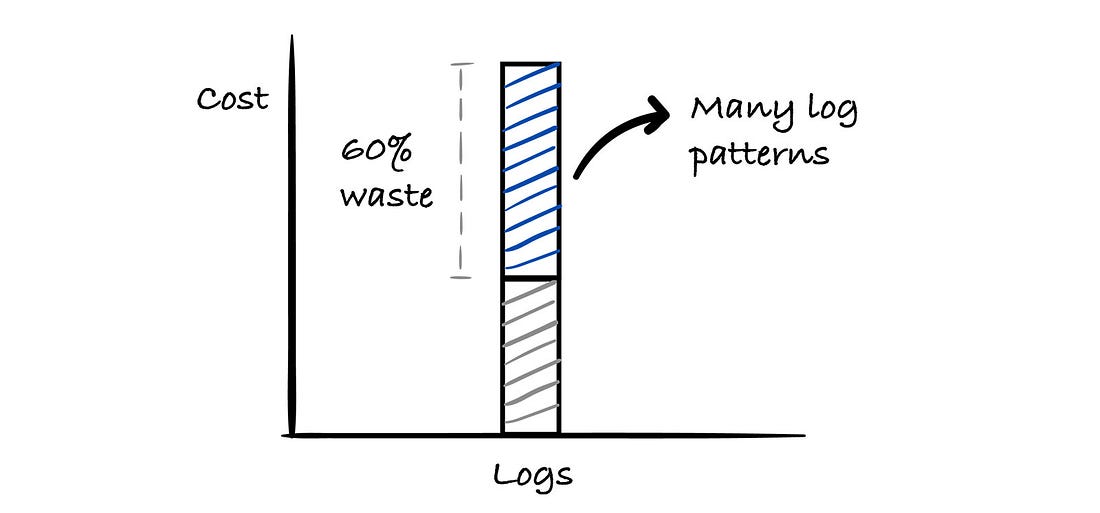
We’d already reduced our tracing sampling to 15% (the minimum we could responsibly manage with head sampling). Metrics had been cleaned up after an earlier incident where high-cardinality dimensions exploded our costs. But I didn’t try to optimize everything at once. I picked the signal where I had the most leverage and went deep on that first. Step 3: Group the data to identify potential wasteI needed a simple way of figuring out which logs had the most volume. I started off grouping by the log message. Grouping by message meant that I could see a broad picture of where we were spending the most. We had structured logs, so I could have started with any other attribute, but message is the one field that all logs tend to have, so it gave me a good overview. However, there’s a big problem with grouping by message. Messages were often unique because they contained variable data: These are 3 different messages, but they are probably coming from the same source, because they have the same pattern: “User X logged in from Y.” Some observability tools can detect these message patterns by figuring out whether certain parts of the message are variable, such as user IDs, IP addresses, and timestamps. Our observability tool supported this, and it was invaluable. Instead of the 3 log messages above, I’d see a pattern of: I sorted by the number of logs in these patterns, which allowed me to see the highest-volume patterns. I then categorized each message pattern from wasteful to valuable. Agonizing over “not sure” message patterns became a distraction and time sink, so if the value wasn’t immediately apparent, I categorized it as “unknown.” As I went through the top 50 highest-volume message patterns, I found that:
Each wasteful log seemed insignificant. But added together, they were costing us $1,500 per month, or $18,000 per year. This was death by a thousand paper cuts. Step 4: Check the value of the dataI needed to be sure that no other team members were using the logs that seemed obviously useless to me. For every log I classified as waste, I checked:
For dashboards and alerts, our observability tool let me trace a log backward to see where it was used. For tools without that capability, I’d suggest taking the dashboards and alerts that are most used by the team and manually listing out all the logs they use. I also looked at our incident postmortems and debugging sessions to see which log queries engineers were actually running when there was an outage.
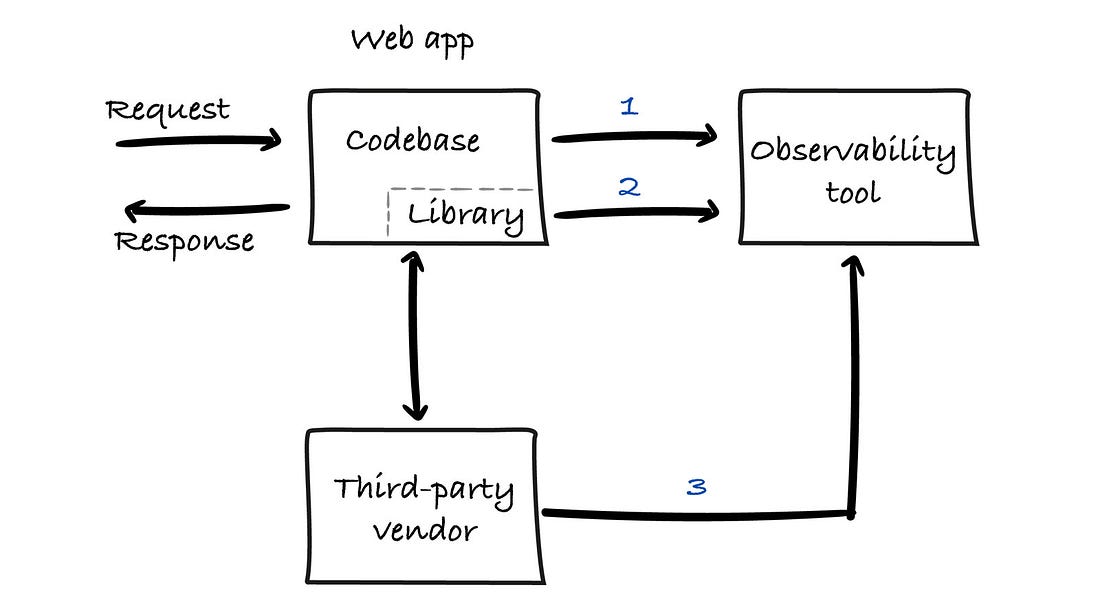
Step 5: Remove instrumentation generating noiseFor each log pattern to remove, I made a separate code change. I wanted to be able to deploy each change independently, monitoring the impact of each change in isolation. That way I could easily roll back if something went wrong. So I followed 3 steps. Step 5.1. Change the code to stop loggingI discovered 3 sources of wasteful logging:
Source 1: Codebase The easiest logs to remove were in our code. I searched our app codebase for the wasteful log message pattern. If I could identify the logging code, the change was easy: Delete the code, update any tests, and deploy. If the logging wasn’t coming from our code, I moved on to the next source. Source 2: Library Next, I searched for the log pattern within the libraries our app depended on. Instrumentation in libraries is more difficult to remove. We didn’t have control over these codebases directly. If I wanted to remove all logging from the library, I would often disable logging using configuration the library exposed. But in other cases, I needed to make more fine-grained adjustments, or the library wouldn’t expose the relevant configuration. In these cases, I resorted to configuring our logger instead of the library. In one example I’ll go into later, I needed to filter out the log message “OK.” Instead of configuring the offending library, which proved impossible, I configured our logger to block that exact message. Source 3: Third-party vendors If the log didn’t come from our code or a library, it was likely coming from a third-party vendor. Vendors such as AWS, Google, Heroku, Segment, Stripe, and Cloudflare allow their logs to be sent to an external observability tool. I found some instances where this logging integration had been set up years ago and then forgotten. There are some obvious clues to look out for in these cases. Often the log to remove would have an attribute such as “app,” “service,” or “source” to indicate that the log was coming from an external vendor. Other times I needed to do deeper detective work. I would look at all the dashboards of our third-party vendors and check for event webhooks or other related settings. This allowed me to see integrations that I could either switch off or tweak to reduce log volumes. Last resort: Blocking at ingest Modern systems are complex. Even in our modestly sized codebase, there were times when I couldn’t figure out exactly where a log was coming from. In those cases, I blocked the logs at the observability tool. This solution is entirely specific to the observability tool, so it’s my least favourite option and a last resort. Double-check that these blocked signals won’t count toward your cost. Some tools allow you to block, but the data ingest is still billed, which isn’t that useful to cost savings. Step 5.2. Deploy it to productionOnce I updated the code, I deployed it to production through a pull request that other team members could review. I generally tagged one other team member who I knew could respond quickly. Step 5.3. Watch whether the log volume droppedI searched for the log pattern I’d removed in our observability tool. When the code was deployed, I was looking for the volume to drop to zero. Previously I’d created log events for when our app was deployed, so I could see the connection between my code being deployed and the logs disappearing. If the wasteful log patterns didn’t go to zero, it implied I’d made a mistake. In those cases, I’d adjust the code and try again. In some cases, I kept an additional eye on other dashboards and alerts to make sure everything was still working. Step 6: Monitor Usage
Once the large volume of wasteful log patterns had been removed, I regularly queried for log message patterns once a month. When I saw suspicious patterns with high volumes, I investigated further and kept on top of costs. Many of the biggest sources of waste arose from my ignorance, so checking the logs every month allowed me to keep an eye on what was being logged and nip any other cost problems in the bud. Examples of common wasteI was surprised at some of the low-hanging fruit that was wasting our precious operational budget. If you audit your observability costs, you might be surprised, too. I uncovered three eye-opening examples of waste:
1. The “OK” log message When going through the top 10 log patterns, one pattern stuck out, appearing over 100 million times per month: OK. What?! Clearly this was a useless message. Investigating further, I discovered that this message was from a third-party library we’d added a few months ago. Buried deep in the library was a health check that ran every few seconds. When the health check passed, it logged a single word: “OK.” This health check was completely invisible to us. It was built into the library, and we’d never noticed that it was costing us hundreds of dollars per month. 2. The statistics spam When I looked at the next highest-volume pattern, I saw logs containing IP addresses and seemingly random numbers: Another library annoyance. This time, the library was logging performance statistics in plain text. These logs were:
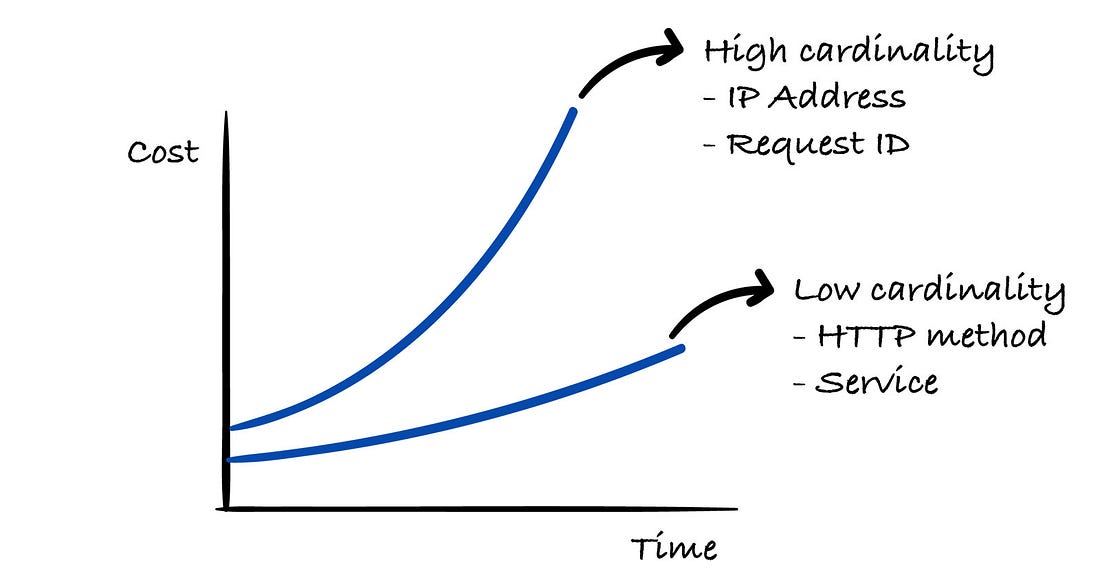
We were paying hundreds of dollars a month to store statistics that we couldn’t analyze and never used. 3. The metrics mistake Before I even started this logging optimization, I had had an expensive lesson with metrics. I’d added a metric to track the p95 response time for each endpoint in our Ruby on Rails app. I had tagged the metric with the controller and action of the request. What I didn’t realize was that we had more than 200 unique combinations of controller and action. Each combination created a separate time series. And in our observability tool, we paid per time series. This one metric was on track to costing us $800 within three weeks.
Thankfully, my manager caught it early and notified me by Slack message. The solution? Derive this metric from our logs on demand. We didn’t need to store it as a metric at all. We removed the metric immediately. My lesson: High-cardinality dimensions on metrics can destroy a budget.
The ResultsFrom this purely self-directed project that I worked on during slack time, I discovered that we were wasting precious operational budget on observability because we were too busy shipping features to review our costs. After 10–15 separate reviews deployed over 2–3 weeks, I was able to reduce our monthly cost by 60%, down to $1,000 a month. That saved us $18,000 a year. I had invested just two days of engineering time, spread over 2–3 weeks and interspersed with regular project work, to find those savings. Removing the logs caused zero production incidents, and we didn’t need any rollbacks. In fact, the team didn’t even notice the changes.
The key is asking: “Are we getting value proportional to what we’re spending?” Our costs had gone from $1,000 to $2,500. Meanwhile:
The tool’s value had risen by maybe 30%, but its cost had risen 150%. This mismatch was a sign that we had waste. Bonus: 6 practical steps for engineering managersIf you’re facing a similar situation, here are six practical steps you can take. 1. Appoint an observability cost expert Find someone on your team who:
This might be you. It might be a senior engineer. It might be a site reliability engineer. It might be an external contractor. Give them ownership of observability costs. 2. Give them a time budget Don’t expect someone to do this in their spare time. Budget one day per month for observability cost review. Yes, that means they won’t be working on features that day. But if you’re wasting $1,500 a month on observability, one day of optimization is worth 12 months of savings. 3. Don’t expect a silver bullet My experience: There was no one big thing to fix. There were 10–15 smaller optimizations that added up. Don’t get discouraged if your first fix only saves $50 a month. Keep going. 4. Understand what your team actually uses This is the hardest part. You need to figure out:
There are three ways you can do this. Option A: Dashboard audit List all your dashboards. For each one, identify which fields are being used. Any instrumentation used on a dashboard should not be removed. Option B: Browser history analysis Sit with each engineer for 15 minutes. Look at their browser history for your observability tool. See what they actually query for. Option C: Ask directly In your next 1:1 meeting ask, “What are the top 3–5 things you look for when debugging in production?” Build a picture of what’s actually valuable versus what’s noise. 5. Think value, not cost Before removing anything, ask:
6. Monitor costs over time Your observability costs should roughly track:
If, for example, costs have doubled but none of those factors doubled, investigate. Set up a simple tracking system:
With modern AI tools, you can build a simple dashboard that pulls cost data from your observability vendor’s API and visualizes trends. Go through the cost-control steps above once a month, and you’ll reduce your bills over time. Final thoughtsI saved my previous employer $18,000 per year with two days of work. Your company might be wasting good money on logs, metrics, and traces that nobody uses. Not because engineers are careless. But because:
If your observability costs feel high, trust your gut. Dig in. You’ll probably find waste. Start small:
You’ll build confidence as you go. Last wordsMany thanks to John for sharing these insights with us! Learn more about him on his Linktr.ee page. Additionally, you can also go through John’s observability spend assessment to gain a better understanding of how you can lower your costs. We are not over yet! Why Engineers Must Become Multipliers in the AI Era (6 Important Trends)The recording of my recent talk at the TechLead conference in Amsterdam in June 2026 is now available. I’ve talked about how the role of engineers is evolving in the AI era.  As development tools become more powerful and accessible, the expectations for engineers are shifting from simply writing code to creating meaningful impact across teams and organizations. The 6 important trends in software engineers points exactly in this direction. Liked this article? Make sure to 💙 click the like button. Feedback or addition? Make sure to 💬 comment. Know someone that would find this helpful? Make sure to 🔁 share this post. Whenever you are ready, here is how I can help you further
Get in touchYou can find me on LinkedIn, X, YouTube, Bluesky, Instagram or Threads. If you wish to make a request on particular topic you would like to read, you can send me an email to info@gregorojstersek.com. This newsletter is funded by paid subscriptions from readers like yourself. If you aren’t already, consider becoming a paid subscriber to receive the full experience! You are more than welcome to find whatever interests you here and try it out in your particular case. Let me know how it went! Topics are normally about all things engineering related, leadership, management, developing scalable products, building teams etc. You're currently a free subscriber to Engineering Leadership. For the full experience, upgrade your subscription.
|





Similar newsletters
There are other similar shared emails that you might be interested in: