10 Charts That Capture How the World Is Changing
10 Charts That Capture How the World Is ChangingFrom Anthropic APIs to Pokémon Cards, AppLovin to AI CapExWeekly writing about how technology and people intersect. By day, I’m building Daybreak to partner with early-stage founders. By night, I’m writing Digital Native about market trends and startup opportunities. If you haven’t subscribed, join 70,000+ weekly readers by subscribing here: 10 Charts That Capture How the World Is ChangingIt’s that time again: time for another entry in the “10 Charts” series. I try to do these once a quarter, and we’re overdue: our last entry was back in June. This is our 10th (!) entry, and you know the drill: I’m a visual learner and charts help me process information. Charts also happen to be an efficient way to show how the world’s changing. We’ll tackle 10 charts that cover a wide range of topics:
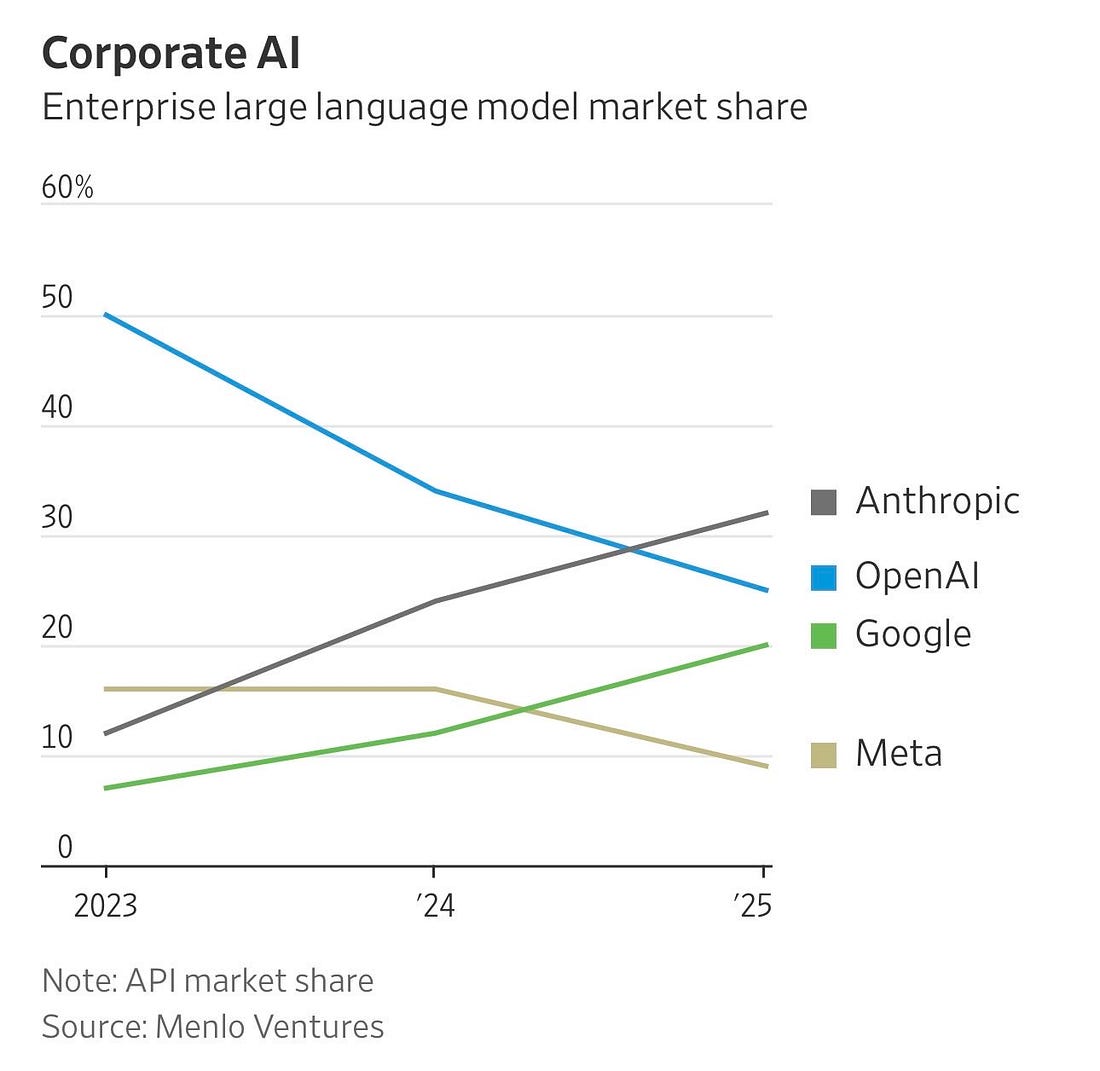
Let’s dive in. 1️⃣ Anthropic = Enterprise, OpenAI = ConsumerIt’s official: Anthropic seems to be the winner in Enterprise AI, while OpenAI dominates Consumer AI. Check out this chart: Pretty impressive execution from the Anthropic team. And credit to Andy Jassy and the Amazon team for a smart investment (Amazon announced its $4B investment into Anthropic in September 2023—and, as you can see in the chart above, it was a less obvious bet then). I only see the enterprise / consumer split further calcifying as time goes on, and you can see diverging focuses in each company’s marketing. Two weeks ago in Taylor Swift, Sora, and Slop vs. Substance, we covered Anthropic’s brand association with intelligence, thinking, and problem-solving, embodied with the Claude Cafe pop-up:
OpenAI, meanwhile, is all-in on the consumer use case. They’re gunning for Google. The billboard below clearly communicates “Ask ChatGPT how to fix your broken car instead of Googling it.”
2️⃣ Smile Curves for ChatGPTSpeaking of ChatGPT, retention curves like this are almost unheard of: This chart commits what I call “y-axis crime,” meaning that the y-axis misleadingly doesn’t start at zero. But in this case, the y-axis crime actually hurts ChatGPT! The curves are even better when you realize the worst cohorts asymptote (then “smile”) in the mid-40s. These types of curves are typically reserved for marketplace or social products that have network effects, meaning they improve as more users join the platforms (e.g., Uber improving with more rider / driver density, or Instagram improving with more of your friends on the app). It’s impressive to have this retention for a single-player product that hasn’t launched social features (although, as we’ve argued, they should!). 3️⃣ Labubu’s DownfallThe Labubu frenzy is fading, and Pop Mart (the furry creature’s maker) has seen shares crater 30% since August. Who could’ve seen this coming?! Well, basically anyone with a brain. Every few years there’s a new irrational bubble—first tulips, then Beanie Babies, then Bored Apes, then Labubus. Humans are driven by a few unchanging motivations. Greed and status are two of the most powerful, and they tend to be the culprits behind frenzies like these.
Here’s a chart of Pop Mart market value surging past other leading toy companies like Hasbro and Mattel earlier this year:
Yet while Labubu is hurting, another collectible is doing just fine… 4️⃣ Pokemon’s Steady RiseThis chart fascinates me—going back 20 years, Pokemon cards are a better return than nearly anything else:
That’s a cool 3,000% gain. $100 invested in Pokemon cards around 2005 would get you $3,000+ today. So what separates a Labubu from a Pokemon card? Good question. There are a few differences that jump out to me:
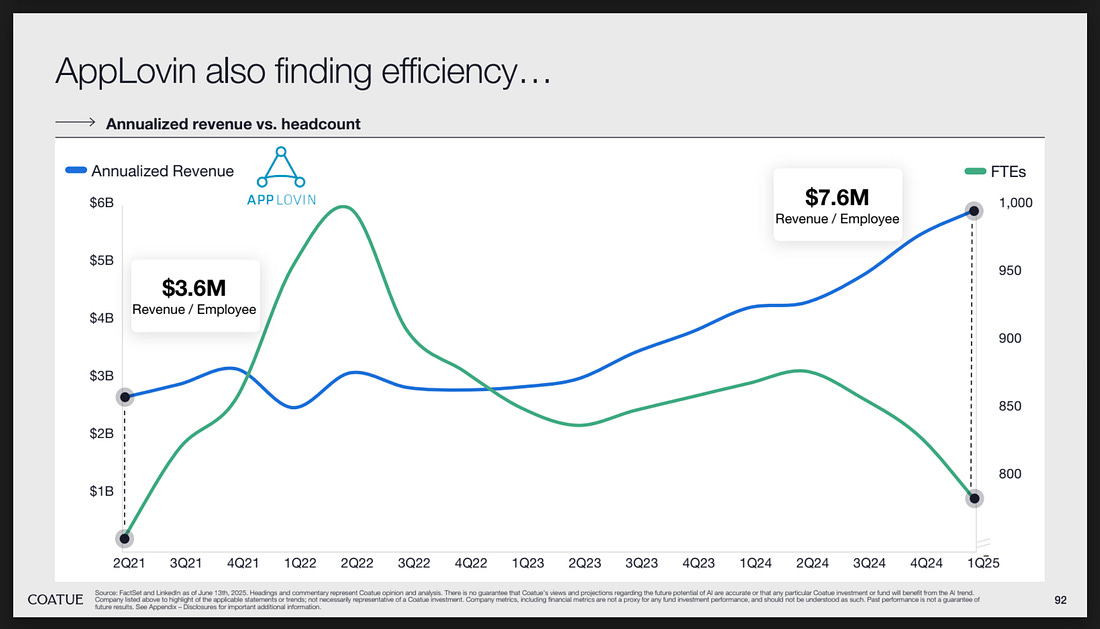
There are plenty of other reasons, but these are a few: durable revenue, reliable buyers and sellers, long-term earned credibility. There’s probably a lesson here for the AI bubble we’re in the midst of. Companies should be asking themselves: am I offering a Labubu or a Pikachu? 5️⃣ The App Economy Moves Beyond GamesThis moment has been a long time coming: non-gaming app revenue finally surpassed gaming app revenue: Consumer app subscription has been a great category for years, powering big companies like Spotify, Tinder, and Duolingo. You can clearly build a $10B+ (even $100B+ in Spotify’s case) consumer internet business on subscription revenue. We have a couple consumer subscription companies in the Daybreak portfolio, including one of our early value-drivers. Consumers are clearly willing to pay for stuff—ads aren’t the only business model in town—and shifts like ATT (making ads less attractive for companies) and Apple Pay (removing friction for paywalls) help push this forward. It’s hard to mention the chart above and not mention AppLovin, one of the best-performing stocks of the year ($212B market cap, up almost 4x in the last year). Our last version of “10 Charts” mentioned AppLovin’s revenue per headcount, which has doubled in recent years:
AppLovin is powering much of the surging non-gaming revenue shown in the chart above, as the company focuses on diversifying away from gaming. For example, AppLovin has strategically expanded into e-commerce, fintech, and business apps. In Q1, AppLovin ad revenue grew +71% year-over-year, largely on the back on non-gaming revenue. The company sold its “Apps” business (mostly mobile games) to Tripledot Studios and now seems focused on its high-margin advertising software platform. And for good reason—from an equity research report: “Given the ~90% incremental margins for APP’s ad business, we would expect a relatively clean translation to earnings where every $100mn of non-gaming ad spend would drive $90mn (or ~1.5%) upside/downside to ‘26 EBITDA.” Not a bad business model. 6️⃣ AI Revenue Overtakes SaaS RevenueAnother example of one type of revenue overtaking another:
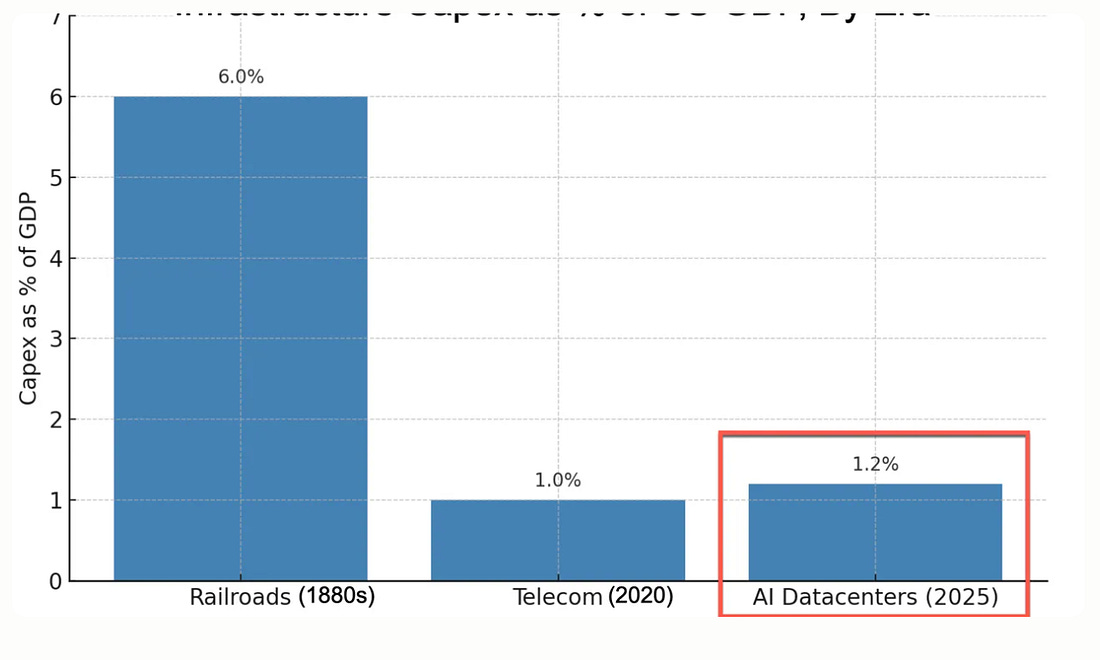
Revenue from AI Labs + public AI infrastructure companies has eclipsed all of public SaaS revenue in 2024. And on a net new revenue basis, it’s nearly 2x. The center of gravity in tech is clearly moving from software to compute. SaaS no longer defines public market tech. Rather, NVIDIA’s datacenter business (and the hyperscalers it powers) are the new backbone of tech. The other way to read this chart, in my mind, is that AI’s value still sits in its “supply chain” (the infrastructure suppliers like NVIDIA, cloud providers, labs) and hasn’t moved downstream to traditional software. Public SaaS companies aren’t yet reaping the benefits of AI, and we’ll see when (or if) that changes. 7️⃣ Will AI CapEx Catch Railroads?To continue with AI spend, Big Tech is spending a lot on AI infrastructure: The way to read this chart is: in the last three months alone, four companies spent almost $100 billion (with a b) on data centers and the like. Here’s how this compares to past eras of innovation:
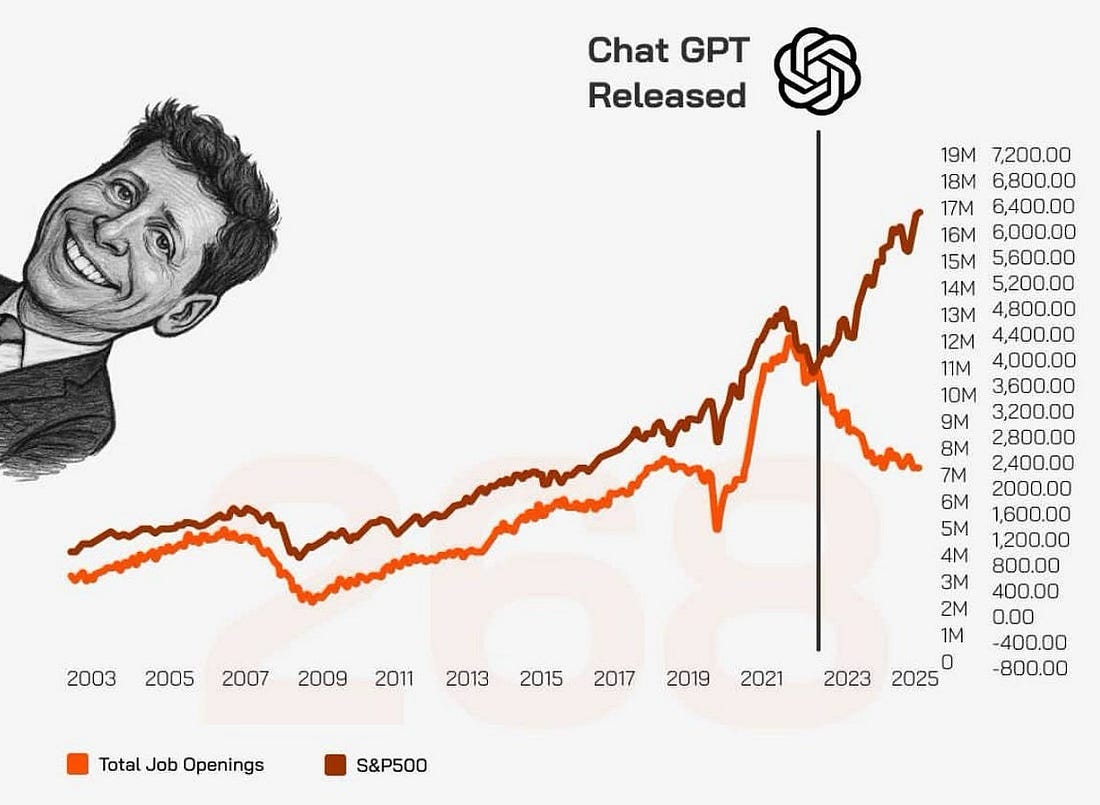
I do worry we’re one bad Nvidia earnings report from a major market correction, but that’s probably inevitable. Eventually the music will stop, at least for a few brief moments, and a little air being let out of the AI sails isn’t a bad thing; things are frothy right now. That said, I don’t think we’ll see CapEx slow much. The bigger question is: how close does CapEx as a percent of GDP creep up toward to the railroad highs of the 1880s? 8️⃣ Capital Markets vs. Labor Markets: The New Normal?We’ve written a lot about how AI is impacting capital markets vs. labor markets. Stocks are roaring, but just yesterday, Amazon announced it will cut 14,000 jobs. (Maybe to justify some of that capex in the prior chart!) There are two interesting charts that tell a story: First, here’s a chart from Derek Thompson that he calls “the scariest chart in the world.” It shows S&P 500 performance alongside job openings.
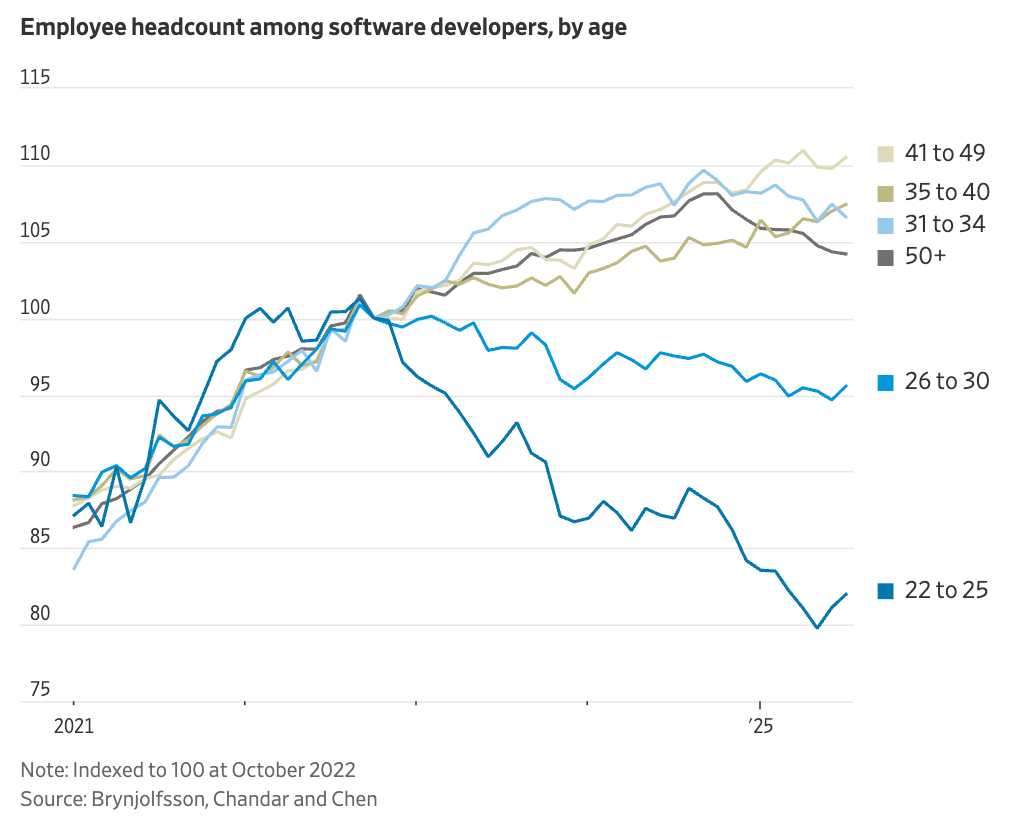
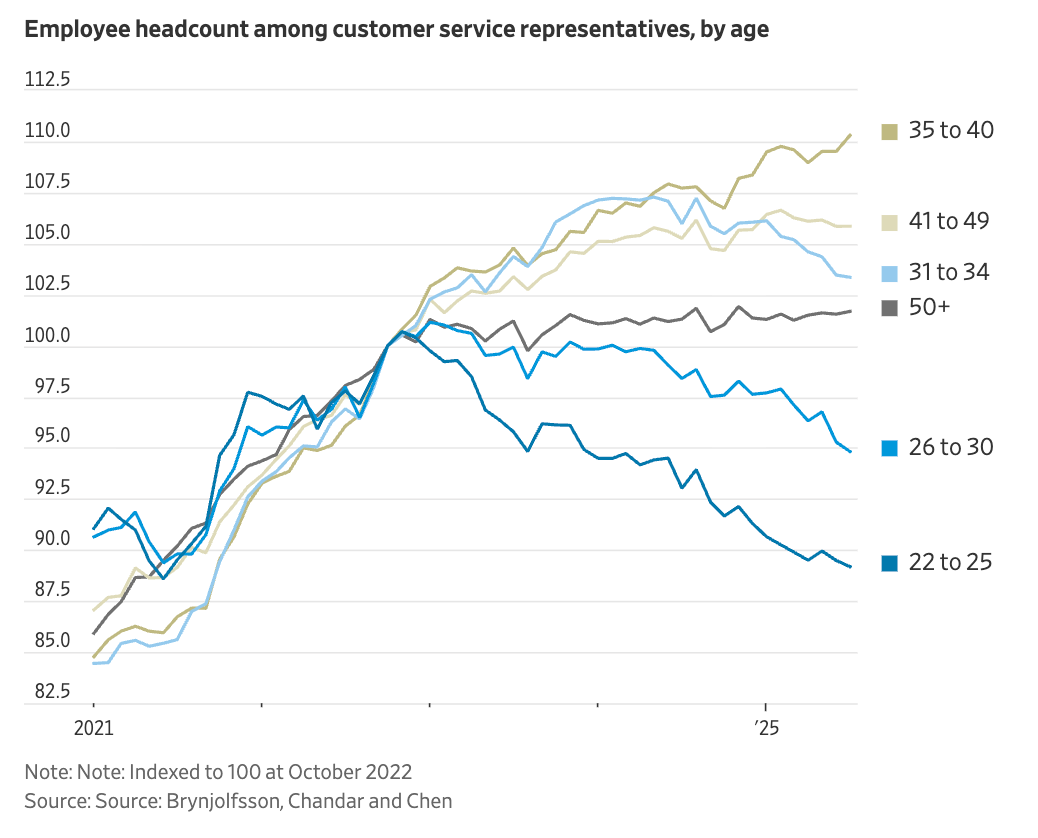
Yikes. My worry here is that this is the new normal. AI augments or even automates human labor. This is great for productivity gains, which translate into capital markets growth, but not so great for the people who, you know…do that labor. I think we’re entering an era where participants in the capital markets accumulate enormous wealth, while participants in salaried and hourly work suffer. This isn’t necessarily a new trend, but it’s one that will be accelerated by AI (especially if we don’t have government intervention to retrain workers). This is one reason I wanted to write about Kalshi and Polymarket in Speculation Nation two weeks ago. If work isn’t going to make people money, people will find other ways to try to make money; this powers a “financialization of everything” that’s one of the biggest trends of our generation. 9️⃣ Rage Against the MachineThe second, related chart worth paying attention to: Senior employees seem to be handling AI labor market shocks just fine. New entrants to the job market? Not so much. This will have massive political and social repercussions for years to come. 🔟 One Bright Spot: Home Care / Home HealthTo continue with job markets, for our final chart: we wrote last month about the Stanford study that found major declines for young people in AI-impacted areas like software development and customer service. Two charts from that Stanford study:
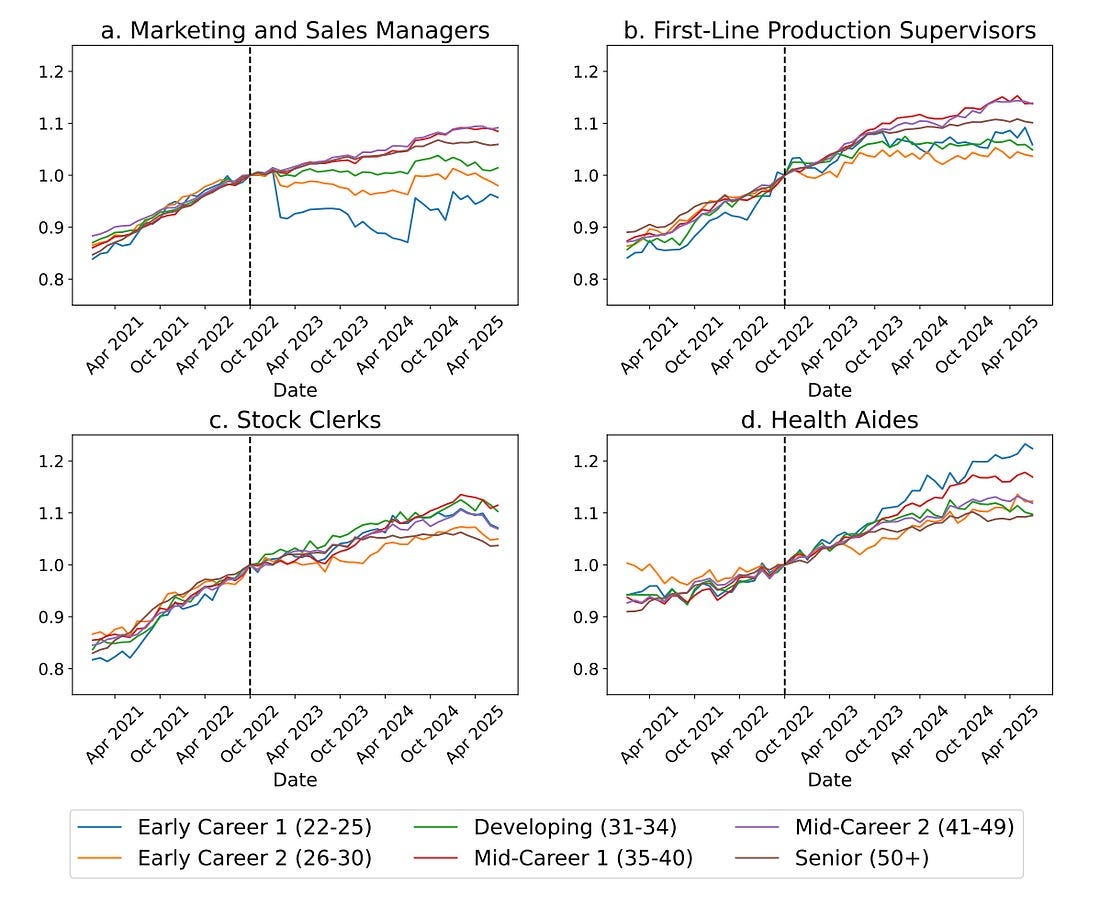
22- to 25-year-olds seem to be hurting. These charts stand in contrast to a rare bright spot in labor markets: home health aides. Check out the bottom right chart here, and you can see essentially the only form of work in which jobs for young people are increasing:
One of our Daybreak companies, Alden, uses AI to supercharge coordination for this workforce. Think: intelligent agents to help with staffing and scheduling, currently a nightmare for home care, senior living, and staffing orgs.
As we see more job loss from AI, there will be other careers that undergo tremendous growth. Home care / home health is one example, given our rapidly aging population. There will be others, mostly in the world of atoms not bits. AI will create a reckoning for labor markets, but there will be other areas that emerge to fill in the gaps. Until next week 🫡That’s a wrap—we’ll be back with another “10 Charts” in a few months. I’ll try to do these once a quarter. See you next week! Thanks for reading! Subscribe here to receive Digital Native in your inbox each week:
|


Similar newsletters
There are other similar shared emails that you might be interested in: