WTF is activation and why should engineers care?
WTF is activation and why should engineers care?An engineer's guide to finding (and using) your product's activation metricWelcome to Product for Engineers!PostHog recently moved you from another platform to Product for Engineers, hosted on Substack. New posts will be automatically delivered to you via email or via the Substack app. Improving activation is one of the most impactful things a product engineer can do, but it’s also weirdly hard to define. People often call it your product’s "aha" moment – i.e. when a user experiences your product's value for the first time – but this is vague and subjective. So why isn't there a simple, universal definition? Because:
One thing is certain, though. You can’t build a successful product without nailing it. Read on to understand why. Why engineers should care about activation1. It's upstream of other metricsIn a way, activation is the base rate of your product. Want more revenue? Improve activation. Weak word-of-mouth growth getting you down? Improve activation. It compounds all the metrics downstream of it. If being a product engineer means caring about the whole business (spoiler: it does), then you should be obsessed with your product’s activation metric. A larger sample size (i.e. more activated users) also makes it easier to analyze and experiment on downstream metrics. TL;DR: Everything is easier when activation is strong. 2. It's something engineers can directly influence
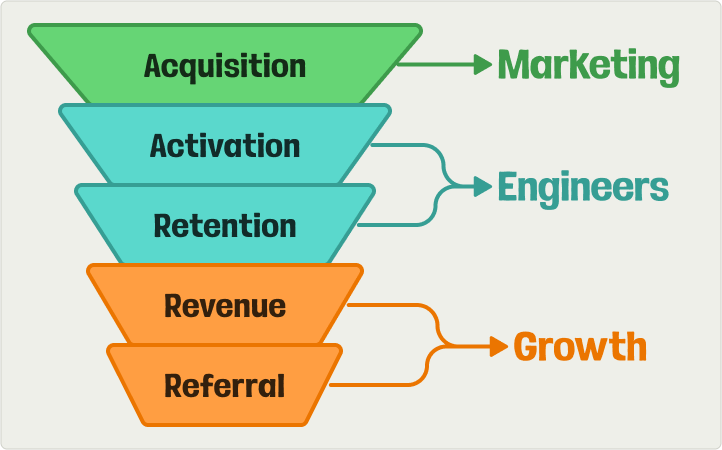
Activation is part of the AARRR funnel. Above it, at the top of the funnel, is acquisition which is mostly a responsibility of marketers. Below it is retention, revenue, and referral. The last two are mostly platform-level metrics, and normally the responsibility of a smaller growth team. That leaves activation and retention as the responsibilities of product engineers. Activation comes first and directly influences retention, so it’s a natural starting point. 3. It’s useful across the organization
As cringe as it is to say it, activation creates “ALIGNMENT” and figuring it out can create a lot of value for your organization as a whole. How we find activation metrics at PostHog
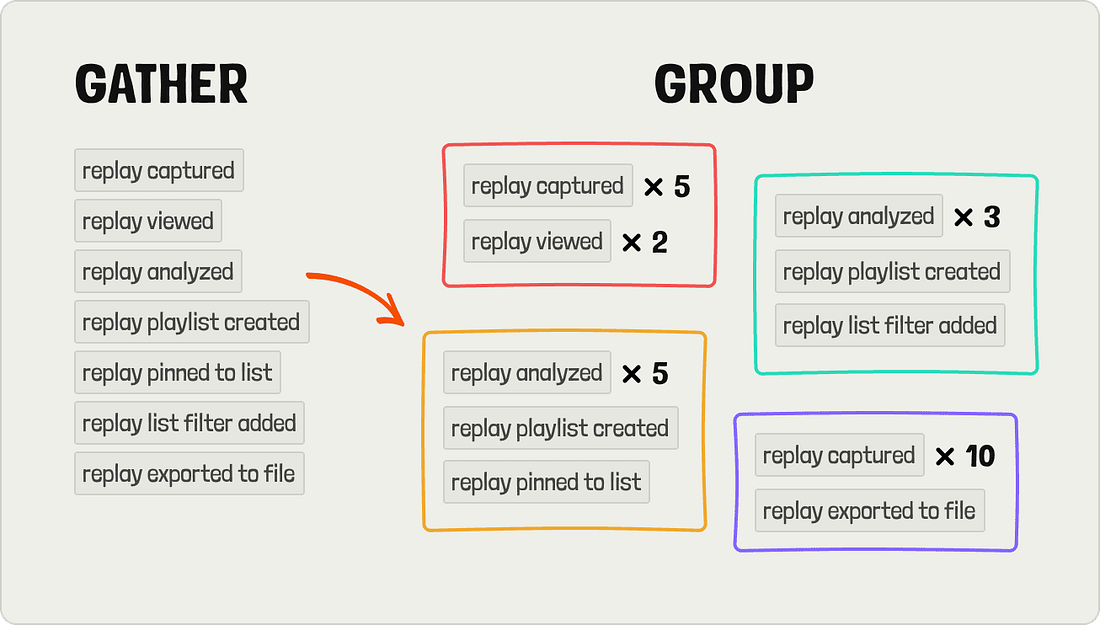
We have 10+ products, each requiring their own activation metric, so we have a lot of experience finding activation metrics that work. Our process starts by gathering a big list of events we think might "hook" users into our product. We get these by looking at usage of that specific product, and by asking customer-facing teams what they think. Next, we create groups of 3-5 events to test together. Typically, we aim for 5-10 different groups, some of which compare how often an event is completed – e.g. watched five replays vs. watched one replay.
Once we have our potential activation metrics, we write an SQL query to test how they correlate with retention. The query starts by getting the companies that signed up for PostHog, broken down by month. We use group analytics to find activated companies rather than individual users, but both work. Next, we filter for companies who completed our collection of activation events in the required time. The time cutoff varies by the natural product lifecycle. It takes longer to collect enough data for product analysis than create an A/B test; therefore, product analytics has a 30-day activation window while experimentation only has 14 days. After finding the companies who activated successfully, we calculate their retention by checking how many are still using the product three months after starting. We then compare the activated retention against our product's average retention rate.
In the above hypothetical example, three companies activated but only two were still using the product after three months, and were therefore retained. This means we have a retention rate of 66% for activated companies:
We repeat this process for each potential activation metric. The one with the best retention rate (and a large enough sample size) wins. Some activation metrics we found with this method:
What to do after you’ve defined activation
1. Track it accuratelyBecause your activation metric events now stand out, it's worth making sure they are tracked accurately. This means:
2. Review itOnce we have an activation metric, it becomes part of our recurring growth reviews. For every product, every month, we check:
The outcome of our growth reviews is a list of action items for the team to work on and then review in the next meeting. 3. See how it correlates with other areasAs activation is one part of the funnel, you can use it to evaluate and improve other parts of the funnel. For example, related to acquisition:
And related to retention, revenue, and referral:
A special, related one for us (and other multi-product companies) is cross-sell. Getting people to activate into multiple products (like product analytics + feature flags) is extremely valuable to us, because they are much more likely to pay, and pay more when they do. Because of the importance of cross-sell, we look at how the activation of one product impacts another, figure out the "right" products to promote for a user's lifecycle, and look for opportunities to promote "cross-activation." This is a big area of focus for our growth team. 4. Just improve it
Eventually, you need to actually build something to help activate users faster or provide them more motivation to activate. Some examples:
In one case for us, because the “replay list filter added” event is part of our activation metric, we focused on changes that encourage users to use playlists like our "What to watch" tab with playlist templates:
Paul Copplestone, CEO of Supabase, gave me a great answer when I asked how they tried to improve their activation metric of "weekly active databases":
Activation, for everyone, is a metric that is both business-critical and infinitely optimizable. For teams not sure how to use analytics to improve their product, this makes it an excellent place to start. Words by Ian Vanagas, who is very serious about activation metrics. 🧠 Good reads to further activate your mind
1 What about my benchmarks bro? Lenny's activation post also has some nice benchmarks for activation, but the ranges are extremely wide. Because the definition of "activation" varies between businesses, there's no real way to compare. When you are battling to increase your activation rates by single digit percentage points, having a range of 20%+ between "ok" and "good" isn't helpful. 2 We found that viewing two web pages (e.g. our docs and product pages) before signing up led to a dramatically higher activation rate, compared to users who went straight from our homepage, or pricing page, to signing up.
|


Similar newsletters
There are other similar shared emails that you might be interested in: