Building eval systems that improve your AI product
Building eval systems that improve your AI productA practical guide to moving beyond generic scores and measuring what matters👋 Each week, I tackle reader questions about building product, driving growth, and accelerating your career. Annual subscribers get a free year of 15+ premium products: Lovable, Replit, Bolt, n8n, Wispr Flow, Descript, Linear, Gamma, Superhuman, Granola, Warp, Perplexity, Raycast, Magic Patterns, Mobbin, and ChatPRD (while supplies last). For more: Lennybot | Lenny’s Podcast | How I AI | Lenny’s Reads | Courses Hamel Husain and Shreya Shankar’s online course, AI Evals for Engineers & PMs, is the #1 highest-grossing course on Maven, and consistently brings in sizable student groups from all of the major AI labs. This is because they teach something crucial: how to build evaluations that actually improve your product, not just generate vanity dashboards. Over the past two years, Hamel and Shreya have played a major role in shifting evals from being an obscure, confusing subject to one of the most necessary skills for AI product builders. After training more than 2,000 PMs and engineers, and leaders at over 500 companies, they’re now sharing their complete playbook—the same methodology taught at OpenAI, Anthropic, and other leading labs. You’ll learn how to leverage error analysis to understand where your AI product breaks, build robust evals you can trust, and create a continuous improvement flywheel that catches regressions before they ship. Thank you for sharing this gold with us, Hamel and Shreya 🙏 P.S. You can listen to this post in convenient podcast form: Spotify / Apple / YouTube.
Aman Khan’s post on evals perfectly captured why evaluation is becoming a core, make-or-break skill for product managers. This article provides the next step: a playbook for building an evaluation system to drive real product improvements. Many teams build eval dashboards that look useful but are ultimately ignored and don’t lead to better products, because the metrics these evals report are disconnected from real user problems. This guide provides a process to bridge that trust gap. We will cover three phases: discovering what to measure through rigorous error analysis, building a reliable evaluation suite, and operationalizing that suite to create a flywheel of continuous improvement. Phase 1: Ground your evals in reality, with error analysisBefore you can improve your AI product, you must understand how it fails. The surface area for what you could evaluate is infinite. The most common mistake is to start by measuring ready-made, fashionable metrics like “hallucination” or “toxicity.” This approach often leads to tracking scores that don’t correlate with the actual problems your users face with your product. You cannot know what to measure until you systematically find out how your product fails in specific contexts. The process that tells you where to focus is referred to as “error analysis” and should result in a clean and prioritized list of your product’s most common failure modes. The process begins not with metrics but with data and a single human expert. For most small to medium-size companies, the most effective approach is to designate a single principal domain expert as the arbiter of quality. This person—a psychologist for a mental health chatbot, a lawyer for legal document analysis—becomes the definitive voice on quality. Appointing a single expert, sometimes called a “benevolent dictator,” provides a consistent and deeply informed signal, which eliminates annotation conflicts and prevents the paralysis that can come from having too many cooks in the kitchen. In many situations, the product manager is the principal domain expert. Larger organizations, or products that span multiple complex domains with different cultural contexts, may require multiple annotators. In those cases, you must implement a more structured process to ensure that judgments are consistent, which involves measuring their agreement. Your next step is to arm this expert with a representative set of around 100 user interactions. As you get more sophisticated, you can sample interactions that are more likely to yield insights based on data analysis. Examples include traces that have negative user feedback, outliers in conversation length, number of tools, and high latency. However, start with random sampling to develop your intuition in the beginning. With a dataset ready, the analysis begins with open coding. This is essentially like journaling, but with a bit of structuring. The domain expert reviews each user interaction and writes a free-form critique on anything that seems wrong or undesirable, as well as giving a pass/fail judgment on the AI performance.
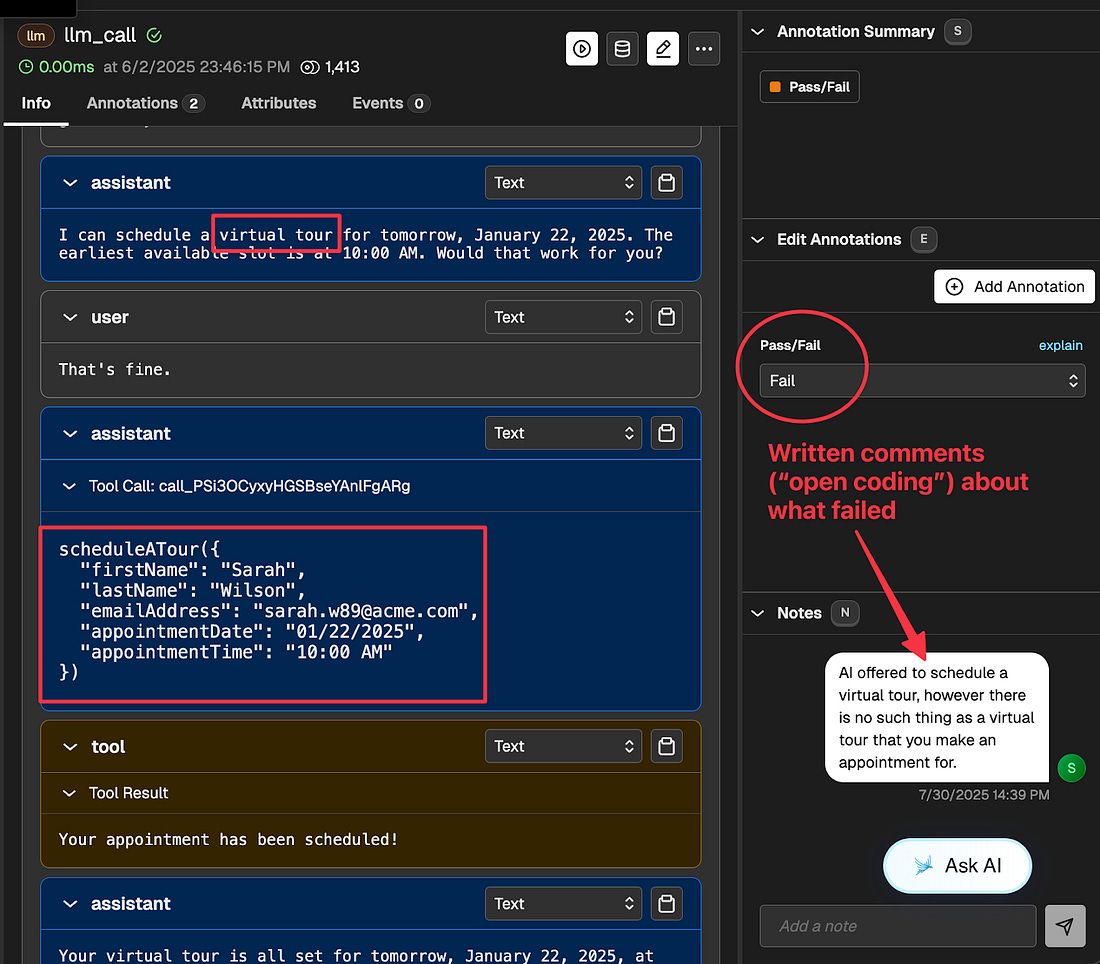
Here is a screenshot of open coding in action in response to an apartment leasing assistant. In the interface, we can see that the AI has hallucinated a virtual tour when that isn’t something that is offered:
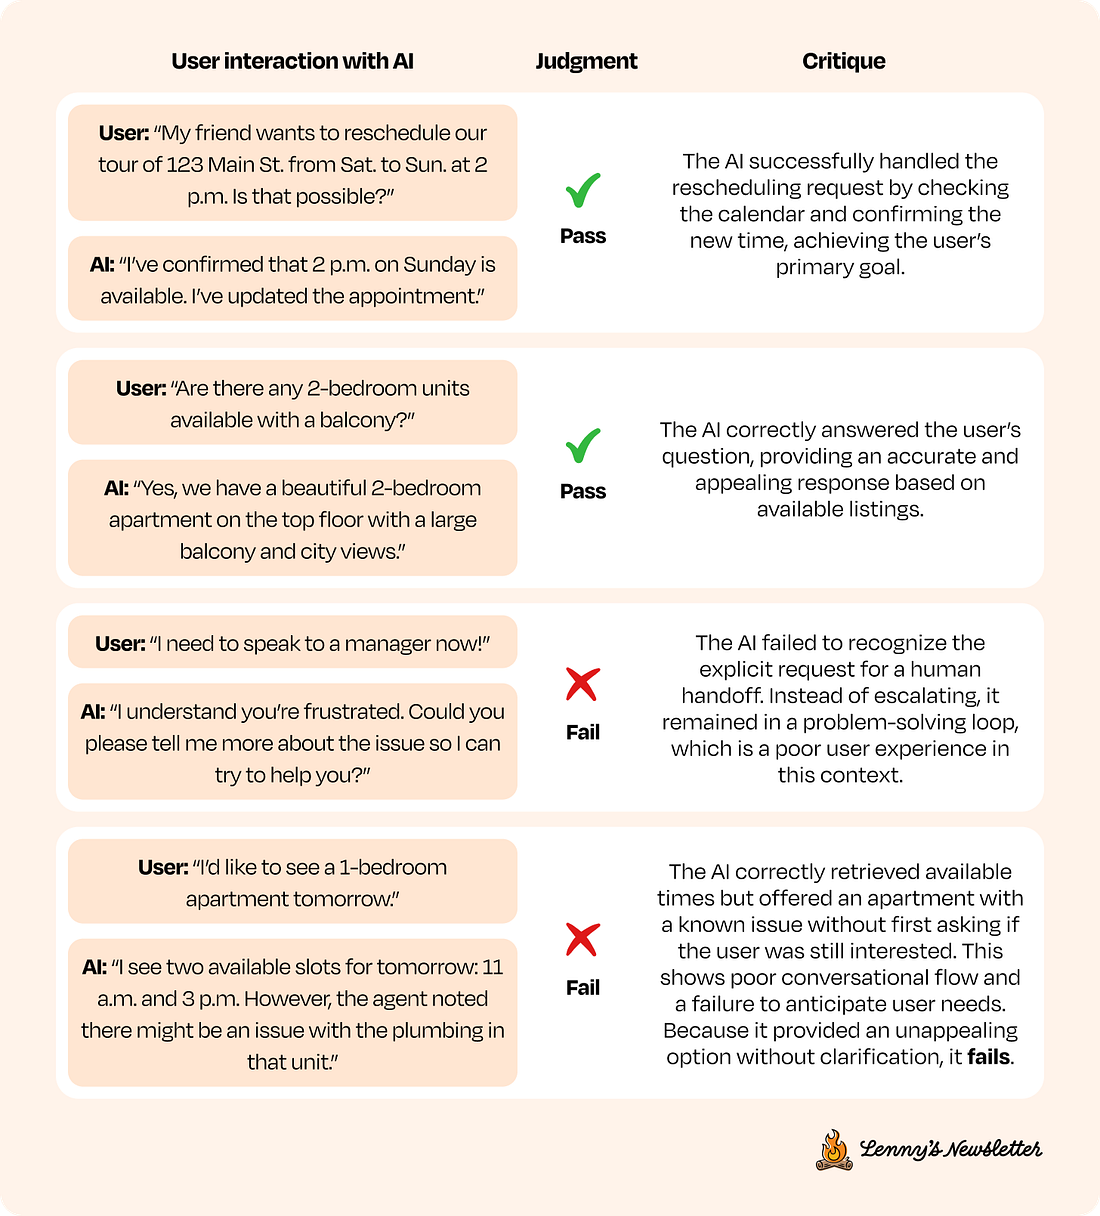
As a heuristic, the critique should be detailed enough for a brand-new employee at your company to understand it. Or, if this is more helpful, so that you can use it in a few-shot prompt for an LLM judge. Being too terse is a common mistake. Here are some good examples of open coding in action:
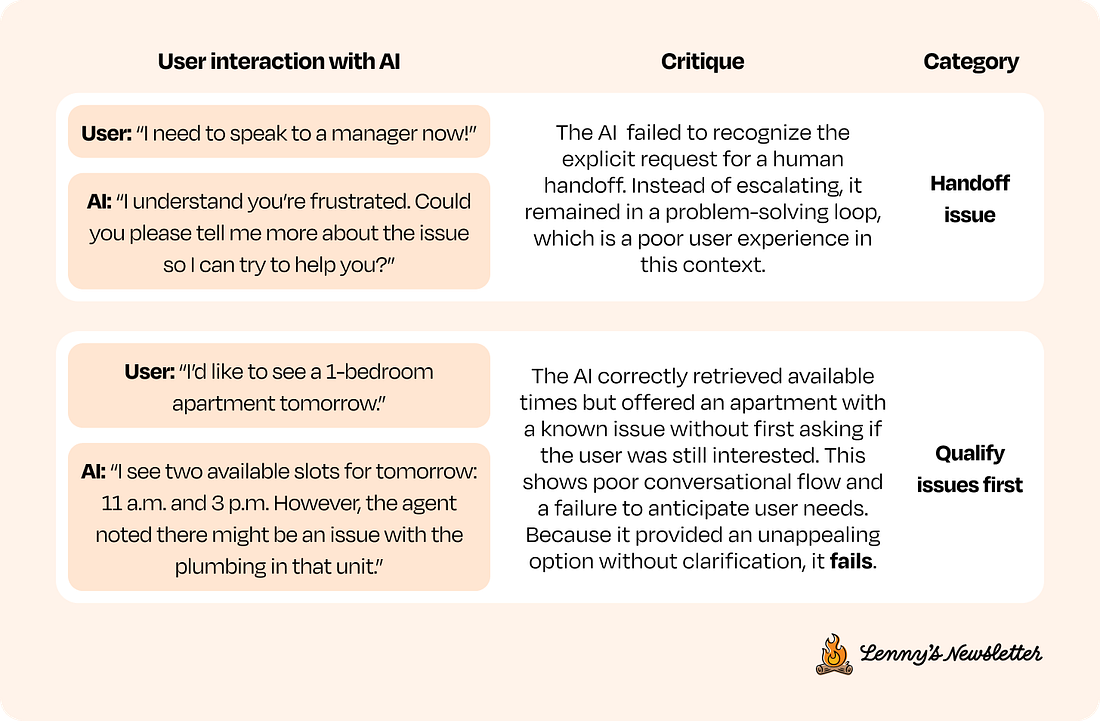
Note that the example user interactions with the AI are simplified for brevity—but you might need to give the domain expert more context to make a judgment. More on that later. This lightly constrained process is crucial for discovering problems you didn’t know you had. It’s also where teams often discover what they truly want from their AI system. Research shows that people are not very good at specifying their complete requirements for an AI up front. It is through the process of reviewing outputs and articulating what feels “wrong” that the true criteria for success emerge. After collecting notes on dozens of traces, the next step is axial coding, or pattern-finding. The expert reads through all the open-ended critiques and starts grouping them (examples below). This process transforms a chaotic list of observations into a clean, prioritized taxonomy of concrete failure modes. It is part art and part science: group errors in a way that is manageable and sensible for your domain. Here is how you might apply axial coding to the failures above:
This grouping process often happens in a spreadsheet or a dedicated annotation tool where you can tag or label each critique. When I was working on this apartment leasing assistant in a real-life scenario, here are the categories that emerged:
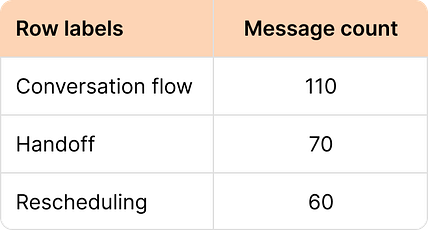
You can accelerate this process with an LLM. You can use an LLM to perform a first-pass categorization on the critiques. However, a common trap is to over-automate. Always have the human expert review and validate the LLM’s suggestions. An LLM might miss the nuance that distinguishes a conversation flow issue from a handoff failure. Another trap is creating too many categories; aim for a manageable set of under 10 primary failure modes that capture the most significant problems. The goal is to create a useful taxonomy that you can analyze, not an exhaustive list. The final product of this phase is to simply count the categories so you can get a sense of how to invest your time. Here is how this count looks for the apartment leasing assistant, which I calculated with a pivot table in a spreadsheet:
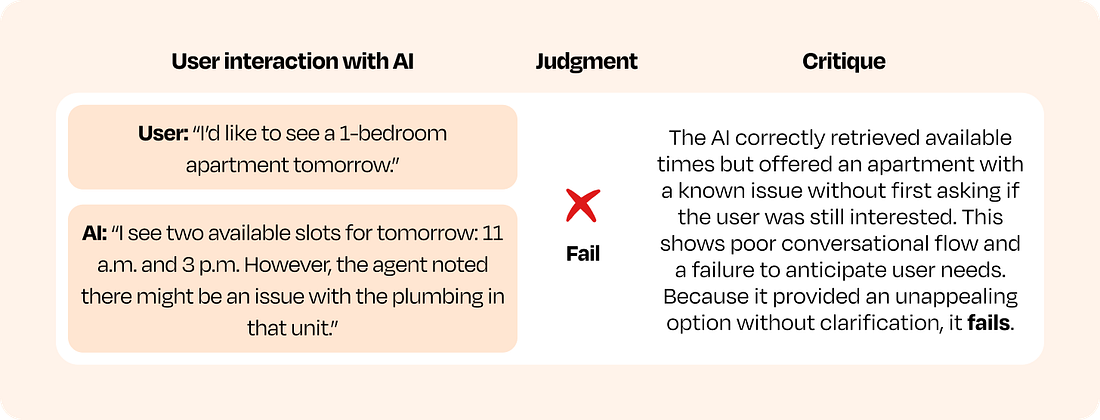
As you can see, the most frequently occurring errors were conversation flow, handoff (to a human), and rescheduling appointments. This data gives us concrete problems specific to our product to focus on as we build evals. A warning about off-the-shelf metricsWhile off-the-shelf metrics like hallucination and toxicity are not worth paying attention to directly, they can be used in creative ways. Instead of reporting a hallucination or toxicity score on a dashboard, calculate the scores on your traces and sort them by high/low score. Reviewing the highest and lowest scoring examples can reveal surprising failure modes or unexpected successes, which in turn helps you build custom evaluators for the patterns you discover. This is one of the only appropriate uses for off-the-shelf metrics. Note that this is an advanced technique and should be done only after you master the basic approach. Phase 2: Build out your evaluation suiteAfter error analysis, you will have a prioritized list of your product’s most common failures. The next step is to build a suite of automated evaluators to track them. The goal is to create a system that is reliable, cost-effective, and trusted by your team. This requires choosing the right tool for each failure mode. Your choice of tools comes down to one question for each prioritized failure mode on your list: Is this failure objective and rule-based (for example: “Does the output contain a user ID?”), or is it subjective and requiring judgment (example: “Was the tone appropriate for the persona?”)? For objective failures, use code-based evaluators. These are simple checks written as code, like assertions in a unit test. They are fast, cheap, and deterministic, making them perfect for verifying things like whether an output is valid JSON, contains a required keyword, or executes without error. Use them whenever a clear rule can define success or failure. For subjective failures, you’ll need to build an LLM-as-a-judge to reliably assess qualities that code cannot easily handle, like tone, relevance, or reasoning quality. This can be a rigorous process—as is training any LLM—but it is the only way to scale nuanced and subjective evaluations and ultimately improve your product. The good news is that there is a scientific approach to making sure the judge is sufficiently aligned with your product vision and success criteria. The LLM-as-a-judge playbookThis is not about writing a clever prompt. It is about a systematic process of grounding an LLM’s judgment in your specific quality bar. The output is an LLM that gives you a binary pass/fail metric for specific error(s). More importantly, you need to trust the metric. The way to establish trust is by measuring the judge against a human-labeled dataset you create. There are two steps involved. The first is to create a dataset that establishes ground truth: 1. Establish ground truthYour evaluation system is only as good as its source of truth. For most teams, the most effective approach is to leverage the principal domain expert we mentioned earlier. While larger organizations operating across multiple domains may require multiple annotators and processes to measure inter-annotator agreement, starting with a single expert accelerates the process. The expert’s task is to provide two things for every user interaction with your AI, grouped by session: a binary pass/fail judgment and a detailed critique. Many teams are tempted to use a 1-to-5 Likert scale, believing it captures more nuance. This is a trap. The distinction between a “3” and a “4” is subjective and inconsistent. Binary decisions force clarity. An output either meets the quality bar or it does not. The nuance is not lost; it is captured in the critique, which explains why a judgment was made. These critiques are the secret ingredient for building a high-fidelity judge. For example, consider this example from earlier:
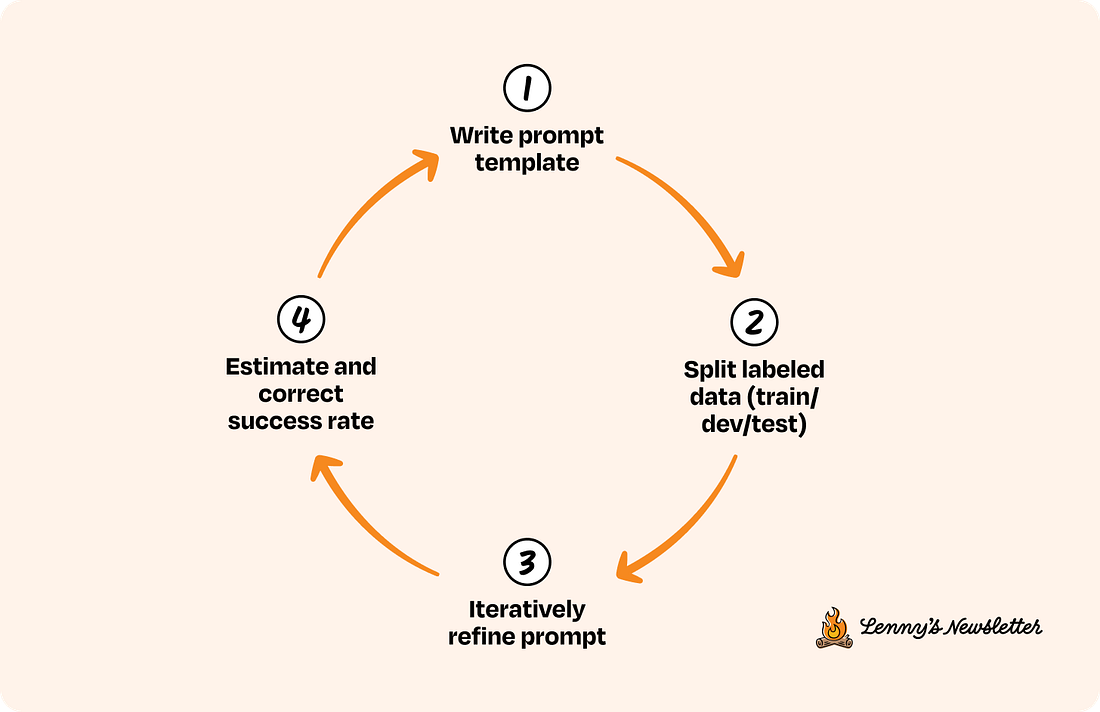
Reasonable people may disagree on whether or not this is “good enough.” However, it is important that you strive toward making a judgment call on what is good and bad for your product. In this case, we decided that this interaction was a failure. 2. Build and validate the judgeAfter you have collected the ground-truth data labeled by your domain expert, you are ready to build and validate the judge. Do not use your entire dataset to build and test your judge. This leads to overfitting, where you iterate toward performing well on examples you observe but fail on new, unseen data. Instead, split the ground-truth data into three distinct sets:
This process of refining your judge’s prompt on the dev set is a meta-evaluation task. You are evaluating your evaluator. It is also where you will discover the nuances of your own quality bar. As research on “criteria drift” has shown, the process of reviewing LLM outputs and aligning a judge helps you articulate and refine your own standards. Below is a visualization of this LLM-as-a-judge alignment process at a high level.
3. Measure what matters: TPR/TNR over accuracyA common impulse is to measure a judge’s performance with a single accuracy score, but this can be dangerously misleading. Imagine an AI system that succeeds 99% of the time. A judge that always predicts “pass” will be 99% accurate, but it will never catch a single failure. This is a common issue with imbalanced datasets, where one outcome is far more frequent than the other. Instead of accuracy, the true positive rate (TPR) and true negative rate (TNR) measured together will tell you precisely how your judge is likely to make mistakes. In plain language:
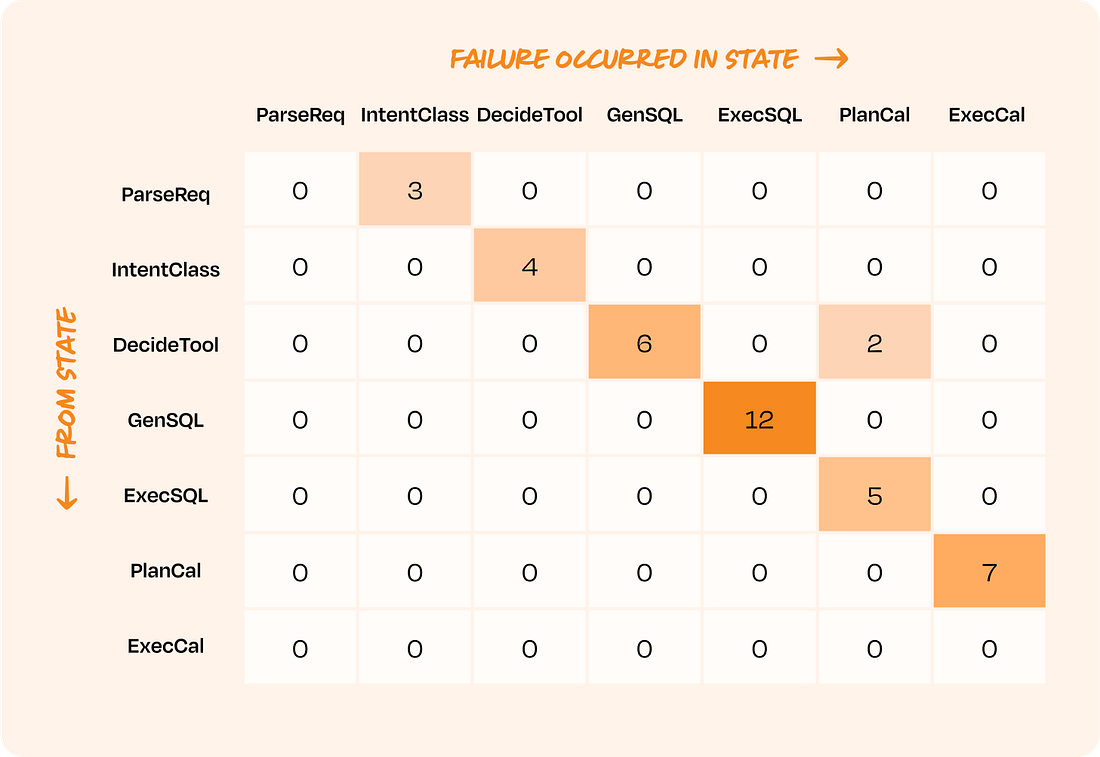
A judge with a high TPR but low TNR is good at recognizing success but lets failures slip through. The acceptable tradeoff depends on your product. For an AI providing medical advice, a false negative (failing to catch a harmful suggestion) is far more costly than a false positive. For a creative writing assistant, a false positive (flagging a good response as bad) might be worse, as it could stifle creativity. Once you know your judge’s TPR and TNR, you can even statistically correct its raw scores to get a more accurate estimate of your system’s true failure rate. For example, if your judge reports a 95% pass rate on 1,000 new examples but you know it has a 10% chance of mislabeling a failure as a pass, you can adjust that 95% score to reflect the judge’s known error rate. (The mathematical details for this correction will be in an appendix). This rigorous, human-led validation process is the only way to build an evaluation system your team can rely on. When you present a dashboard showing a 5% failure rate for a critical feature, your stakeholders need to believe that number reflects reality. This process is how you build that trust. Considerations for specific architecturesThere are special considerations and strategies to keep in mind when designing evals for multi-turn conversations, RAG pipelines, and agentic workflows. We address each of them below. Multi-turn conversations Many AI products are conversational, which introduces the challenge of maintaining context over time. When evaluating conversations, start at the highest level: Did the entire session achieve the user’s goal? This session-level pass/fail judgment is the most important measure of success. When a conversation fails, the next step is to isolate the root cause. A common mistake is to assume the failure is due to the complexities of dialogue. Before you dive into multi-turn analysis, try to reproduce the failure in a single turn. For example, if a shopping bot gives the wrong return policy on the fourth turn, first ask it directly: “What is the return policy for product X1000?” If it still fails, the problem is likely a simple knowledge or retrieval issue. If it succeeds, you have confirmed the failure is conversational—the bot is losing context or misinterpreting information from earlier in the dialogue. This diagnostic step saves significant time by distinguishing simple knowledge gaps from true conversational memory failures. Retrieval-augmented generation (RAG) A RAG system is a two-part machine: a retriever finds information, and a generator writes an answer using that information. These two parts can fail independently, and an end-to-end correctness score will not tell you which one is broken. You must evaluate them separately. First, evaluate the retriever. Treat it as a search problem. To do this, you need a dataset of queries paired with their known correct documents. The most critical metric for RAG is often recall@k. This measures what percentage of all the truly relevant documents are captured within the top k results your system retrieves. Recall is paramount because if the correct information is not retrieved, the generator has no chance of producing a correct answer. Modern LLMs are surprisingly adept at ignoring irrelevant noise in their context, but they cannot invent facts from missing information. The value of k is a critical tuning parameter that depends on your task. For a simple query requiring a single fact, like “What are the property taxes for 123 Main St.?,” a small k (e.g. 3 to 5) is often sufficient. The main goal is to ensure that the one correct document is retrieved. However, for a complex query that requires synthesizing information from multiple sources, such as “Summarize recent market trends for 3-bedroom houses in downtown,” you'll need a larger k (e.g. 10 to 20) to provide the generator with enough context to build a comprehensive answer. While recall is the priority for the initial retrieval stage, precision@k (the fraction of retrieved documents that are relevant) becomes important in systems with a second, re-ranking stage designed to select the best few documents to pass to the LLM. Once your retriever is performing well on a diverse set of queries, you can evaluate the generator. Here you are primarily measuring two things. First is faithfulness: does the generated answer stick to the facts provided in the retrieved context, or is it hallucinating? Second is answer relevance: does the answer directly address the user’s original question? An answer can be perfectly faithful to the source documents but still fail to be relevant to the user’s intent. Fix your retriever first. Only when you are confident that the right information is consistently being fed to your generator should you focus heavily on improving the generation step. It should be noted that RAG is a very nascent topic, and there is still much to be explored in terms of evaluating and optimizing it. See this series for an exploration of advanced RAG topics. Agentic workflows Agents—which can execute a sequence of actions, like tool calls, to accomplish a goal—are the most complex systems to evaluate. A single pass/fail judgment on the final outcome is a good start, but it is not diagnostic. When an agent fails, you need to know which step in the chain of reasoning broke. For this, a transition failure matrix is an invaluable tool. Think of an agent’s workflow as a series of states or steps, like an assembly line. The agent moves from one state (e.g. generating_sql) to the next (e.g. executing_sql). A transition failure matrix is a chart that shows you exactly where the assembly line breaks down most often.
The rows of the matrix represent the last successful step, and the columns represent the step where the failure occurred. By analyzing traces of failed agent interactions and mapping them onto this matrix, you can quickly spot hotspots. Instead of guessing, you can see with data that, for example, your agent fails most often when trying to execute the SQL it just generated, or when it misinterprets the output from a tool call. This transforms the overwhelming task of debugging a complex agent into a focused, data-driven investigation. With these targeted evaluation strategies for complex systems, you are now ready to operationalize your full evaluation suite. Phase 3: Operationalizing evals for continuous improvement...Subscribe to Lenny's Newsletter to unlock the rest.Become a paying subscriber of Lenny's Newsletter to get access to this post and other subscriber-only content. A subscription gets you:
|
Similar newsletters
There are other similar shared emails that you might be interested in: